Momentum trading
![]()
![]()
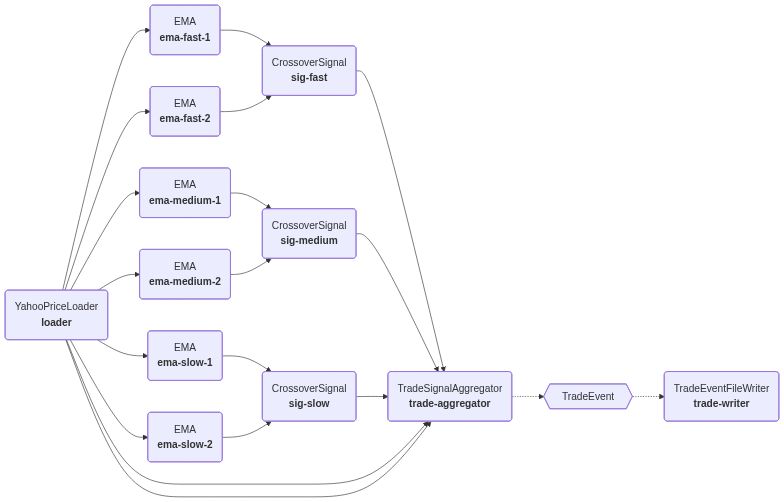
This notebook implements a simple momentum strategy on the S&P 500 using Plugboard’s event-driven components:
- Data source: streams S&P 500 prices from Yahoo! Finance;
- Indicators: three pairs of exponential moving averages (fast/medium/slow);
- Signals: compare EMAs to create buy/sell signals;
- Events: combine three signals into a TradeEvent (weak/strong buy/sell);
- Sink: write trades to a CSV file for inspection.
You can run the process, then visualize trades on a price chart.
# Install plugboard and dependencies for Google Colab
!pip install -q plugboard yfinance plotly
Here's a diagram to illustrate the whole process:
Imports and helpers
We import Plugboard’s core building blocks and define a small helper to create connectors:
- Components expose named inputs/outputs and can emit/receive events.
- Connectors move values between component fields.
- Event connectors route declared events between publishers and subscribers automatically.
import pandas as pd
import datetime as dt
import typing as _t

from plugboard.connector import AsyncioConnector, ConnectorBuilder
from plugboard.events import EventConnectorBuilder
from plugboard.process import LocalProcess
from plugboard.schemas import ConnectorSpec

import pandas as pd
import plotly.graph_objects as go

import yfinance as yf
from pydantic import BaseModel
from plugboard.events import Event

from plugboard.component import Component, IOController as IO
from plugboard.schemas import ComponentArgsDict

# Helper to create field connectors
connect = lambda src, tgt: AsyncioConnector(spec=ConnectorSpec(source=src, target=tgt))
Components: data and indicators
- YahooPriceLoader streams price and timestamp row-by-row from Yahoo Finance for ^GSPC.
- EMA consumes
priceand emits an exponentially weighted moving average asema.
Components declare their I/O via IOController, giving Plugboard enough metadata to wire processes.
def _ensure_dt(val: _t.Any) -> dt.datetime:
    if isinstance(val, dt.datetime):
        return val
    if isinstance(val, dt.date):
        return dt.datetime.combine(val, dt.time())
    return pd.to_datetime(val).to_pydatetime()


class YahooPriceLoader(Component):
    """Loads historical prices for a symbol from Yahoo Finance and streams them row by row.

    Outputs per step:
        price: float - adjusted close price (or close if adj not present)
        timestamp: datetime
    """

    io = IO(outputs=["price", "timestamp"])  # stream out prices

    def __init__(
        self,
        symbol: str = "^GSPC",
        period: str | None = None,
        start: str | dt.date | None = None,
        end: str | dt.date | None = None,
        interval: str = "1d",
        limit: int | None = None,
        **kwargs: _t.Unpack[ComponentArgsDict],
    ) -> None:
        super().__init__(**kwargs)
        self.symbol = symbol
        self.period = period
        self.start = start
        self.end = end
        self.interval = interval
        self.limit = limit
        self._data: pd.DataFrame | None = None
        self._iter = 0

    async def _ensure_data(self) -> None:
        if self._data is not None:
            return
        if yf is None:  # pragma: no cover - runtime safeguard
            raise RuntimeError("yfinance not installed. Please 'pip install yfinance'.")
        df = yf.download(
            self.symbol,
            period=self.period,
            start=self.start,
            end=self.end,
            interval=self.interval,
            progress=False,
        )
        if df.empty:
            raise RuntimeError(f"No data returned for symbol {self.symbol}")
        # Prefer Adj Close if exists
        if "Adj Close" in df.columns:
            df.rename(columns={"Adj Close": "AdjClose"}, inplace=True)
            price_col = "AdjClose"
        elif "Close" in df.columns:
            price_col = "Close"
        else:
            price_col = df.columns[0]
        df = df[[price_col]].rename(columns={price_col: "price"})
        df.index.name = "timestamp"
        df.reset_index(inplace=True)
        if self.limit is not None:
            df = df.head(self.limit)
        # Remove column multi-index if present
        self._data = df.droplevel(1, axis="columns")

    @property
    def df(self) -> pd.DataFrame:
        """The full DataFrame of loaded price data."""
        if self._data is None:
            raise RuntimeError("Data not yet loaded. Call step() first.")
        return self._data

    async def step(self) -> None:  # noqa: D401
        await self._ensure_data()
        if self._iter >= len(self._data):
            await self.io.close()
            return
        row = self._data.iloc[self._iter]
        self.price = float(row["price"])
        ts = row["timestamp"]
        self.timestamp = _ensure_dt(ts)
        self._iter += 1
class EMA(Component):
    """Computes an exponential moving average of an input price stream.

    Inputs:
        price: float
    Outputs:
        ema: float
    """

    io = IO(inputs=["price"], outputs=["ema"])

    def __init__(
        self,
        alpha: float | None = None,
        span: int | None = None,
        **kwargs: _t.Unpack[ComponentArgsDict],
    ) -> None:
        super().__init__(**kwargs)
        if alpha is None and span is None:
            raise ValueError("Provide either alpha or span")
        if alpha is not None and not (0 < alpha <= 1):
            raise ValueError("alpha must be (0,1]")
        self.alpha = alpha if alpha is not None else 2 / (span + 1)
        self._ema: float | None = None

    async def step(self) -> None:
        price = float(self.price)
        if self._ema is None:
            self._ema = price
        else:
            self._ema = self.alpha * price + (1 - self.alpha) * self._ema
        self.ema = self._ema
Components: signals and events
- CrossoverSignal reads two EMAs (
fast,slow) and emits a directionalsignal. - TradeSignalAggregator takes three signals plus the current
priceandtimestamp, and emits aTradeEventwith direction/size/strength. - TradeEventFileWriter subscribes to
TradeEventand appends a CSV row per event.
class CrossoverSignal(Component):
    """Generates buy/sell/hold signal from two moving averages.

    Inputs:
        fast: float
        slow: float
    Outputs:
        signal: int (1=buy, -1=sell)
    """

    io = IO(inputs=["fast", "slow"], outputs=["signal"])

    def __init__(self, **kwargs: _t.Unpack[ComponentArgsDict]) -> None:
        super().__init__(**kwargs)

    async def step(self) -> None:
        fast = float(self.fast)
        slow = float(self.slow)
        self.signal = 1 if fast >= slow else -1
class TradeData(BaseModel):
    """Data for a trade decision.

    side: "buy" or "sell"
    size: number of units
    price: execution price
    timestamp: event time
    strength: "strong" | "weak"
    count_buy: number of buy signals
    count_sell: number of sell signals
    """

    side: _t.Literal["buy", "sell"]
    size: int
    price: float
    timestamp: dt.datetime
    strength: _t.Literal["strong", "weak"]
    count_buy: int
    count_sell: int


class TradeEvent(Event):
    """Event emitted when strategy decides to trade."""

    type: _t.ClassVar[str] = "trade_event"
    data: TradeData


class TradeSignalAggregator(Component):
    """Aggregates three crossover signals into trade events.

    Inputs:
        s1, s2, s3 (int signals: 1 buy, -1 sell, 0 hold)
        price (float)
        timestamp (datetime)
    Output events:
        TradeEvent
    Logic:
        strong buy  = 3 buys -> size 2
        weak buy    = 2 buys 1 sell -> size 1
        strong sell = 3 sells -> size 2
        weak sell   = 2 sells 1 buy -> size 1
    """

    io = IO(
        inputs=["s1", "s2", "s3", "price", "timestamp"],
        output_events=[TradeEvent],
    )

    def __init__(self, **kwargs: _t.Unpack[ComponentArgsDict]) -> None:
        super().__init__(**kwargs)
        self._previous_signal: int | None = None

    async def step(self) -> None:
        signals = [int(self.s1), int(self.s2), int(self.s3)]
        count_buy = sum(1 for s in signals if s == 1)
        count_sell = sum(1 for s in signals if s == -1)
        net_signal = count_buy - count_sell
        if net_signal >= 2:
            decision, strength, size = "buy", "strong", 2
        elif net_signal == 1:
            decision, strength, size = "buy", "weak", 1
        elif net_signal <= -2:
            decision, strength, size = "sell", "strong", 2
        elif net_signal == -1:
            decision, strength, size = "sell", "weak", 1

        if net_signal != self._previous_signal:
            self._logger.info(
                f"Emitting trade decision", decision=decision, size=size, strength=strength
            )
            trade = TradeEvent(
                source=self.name,
                data=TradeData(
                    side=decision,
                    size=size,
                    price=float(self.price),
                    timestamp=_ensure_dt(self.timestamp),
                    strength=strength,
                    count_buy=count_buy,
                    count_sell=count_sell,
                ),
            )
            self.io.queue_event(trade)
            self._previous_signal = net_signal
class TradeEventFileWriter(Component):
    """Consumes trade events and writes them to a CSV file (append mode)."""

    io = IO(input_events=[TradeEvent])

    def __init__(self, path: str = "trades.csv", **kwargs: _t.Unpack[ComponentArgsDict]) -> None:
        super().__init__(**kwargs)
        self.path = path
        # Write header
        with open(self.path, "w", encoding="utf-8") as f:
            f.write("timestamp,side,size,price,strength,count_buy,count_sell,source\n")

    @TradeEvent.handler
    async def handle_trade(self, event: TradeEvent) -> None:  # noqa: D401
        d = event.data
        with open(self.path, "a", encoding="utf-8") as f:
            f.write(
                f"{d.timestamp.isoformat()},{d.side},{d.size},{d.price:.4f},{d.strength},{d.count_buy},{d.count_sell},{event.source}\n"
            )
Wire the process
Here we:
- Instantiate the source, indicator, signal, aggregator, and writer components.
- Connect fields with
AsyncioConnector(price→EMAs, EMAs→signals, signals→aggregator). - Build event connectors so
TradeEventflows from the aggregator to the file writer. - Create a
LocalProcessto run everything in-process.
# Build components
price_loader = YahooPriceLoader(name="loader", period="10y", interval="1d")

# Three EMAs with different speeds (adjust spans as desired)
ema_fast_1 = EMA(name="ema-fast-1", span=8)
ema_fast_2 = EMA(name="ema-fast-2", span=15)
ema_medium_1 = EMA(name="ema-medium-1", span=30)
ema_medium_2 = EMA(name="ema-medium-2", span=50)
ema_slow_1 = EMA(name="ema-slow-1", span=80)
ema_slow_2 = EMA(name="ema-slow-2", span=150)

# Signals from different pairings
sig_fast = CrossoverSignal(name="sig-fast")
sig_medium = CrossoverSignal(name="sig-medium")
sig_slow = CrossoverSignal(name="sig-slow")

# Aggregator producing trade events
aggregator = TradeSignalAggregator(name="trade-aggregator")
trade_writer = TradeEventFileWriter(name="trade-writer", path="trades.csv")

components = [
    price_loader,
    ema_fast_1,
    ema_fast_2,
    ema_medium_1,
    ema_medium_2,
    ema_slow_1,
    ema_slow_2,
    sig_fast,
    sig_medium,
    sig_slow,
    aggregator,
    trade_writer,
]

# Field connectors
connectors = [
    # Price to EMAs
    connect("loader.price", "ema-fast-1.price"),
    connect("loader.price", "ema-fast-2.price"),
    connect("loader.price", "ema-medium-1.price"),
    connect("loader.price", "ema-medium-2.price"),
    connect("loader.price", "ema-slow-1.price"),
    connect("loader.price", "ema-slow-2.price"),
    # Convert the three pairs of EMAs into signals
    connect("ema-fast-1.ema", "sig-fast.fast"),
    connect("ema-fast-2.ema", "sig-fast.slow"),
    connect("ema-medium-1.ema", "sig-medium.fast"),
    connect("ema-medium-2.ema", "sig-medium.slow"),
    connect("ema-slow-1.ema", "sig-slow.fast"),
    connect("ema-slow-2.ema", "sig-slow.slow"),
    # Signals + price + timestamp into aggregator
    connect("sig-fast.signal", "trade-aggregator.s1"),
    connect("sig-medium.signal", "trade-aggregator.s2"),
    connect("sig-slow.signal", "trade-aggregator.s3"),
    connect("loader.price", "trade-aggregator.price"),
    connect("loader.timestamp", "trade-aggregator.timestamp"),
]

# Event connectors
builder = ConnectorBuilder(connector_cls=AsyncioConnector)
event_builder = EventConnectorBuilder(connector_builder=builder)
event_connectors = list(event_builder.build(components).values())

process = LocalProcess(components=components, connectors=connectors + event_connectors)
Run the process
Running the process iterates over the price history, updates indicators, produces signals, emits trade events, and writes them to trades.csv.
async with process:
    await process.run()
Visualize trades from CSV
After the run, trades.csv contains one row per TradeEvent. We overlay buy/sell markers on the price series to see where the strategy acted.
df_prices = price_loader.df
df_trades = pd.read_csv("trades.csv", parse_dates=["timestamp"])

traces = [
    go.Scatter(x=df_prices["timestamp"], y=df_prices["price"], mode="lines", name="Price"),
    go.Scatter(
        x=df_trades[df_trades["side"] == "buy"]["timestamp"],
        y=df_trades[df_trades["side"] == "buy"]["price"],
        mode="markers",
        name="Buy",
        marker=dict(
            color="green",
            symbol="triangle-up",
            size=df_trades[df_trades["side"] == "buy"]["strength"].map(
                lambda x: 18 if x == "strong" else 12
            ),
        ),
    ),
    go.Scatter(
        x=df_trades[df_trades["side"] == "sell"]["timestamp"],
        y=df_trades[df_trades["side"] == "sell"]["price"],
        mode="markers",
        name="Sell",
        marker=dict(
            color="red",
            symbol="triangle-down",
            size=df_trades[df_trades["side"] == "sell"]["strength"].map(
                lambda x: 18 if x == "strong" else 12
            ),
        ),
    ),
]
fig = go.Figure(data=traces)
fig
Visualize the process diagram
We can render a Mermaid diagram of the Plugboard process, showing components, fields, and event flows. This helps debug and document the model wiring.
# Visualise the process
from plugboard.diagram import MermaidDiagram

diagram_md = MermaidDiagram.from_process(process)
diagram_md.url
Next steps
Potential enhancements to this example could include:
- Adding a component to track PnL from the trades;
- Using
plugboard.tuneto choose the moving averages to optimise PnL.